Gold is in a downtrend: Mapping support levelsGold is showing signs of an intermediate term downtrend, whereas silver has no signal of further continuation of the downtrend it began since the commodities boom in 2011.
The Silver/Gold ratio chart also shows an interesting level in effect, and a possible bottom, meaning it might be time to exchange our gold for silver...
As a sidenote, the usdollar/dxy chart is showing possible signs of an uptrend continuation of at least 6 weeks, so it's fairly possible that this forecast will be accurate. Intermediate term dollar strength before any meaningful reversal in gold.
I'll expand this post with a short term gold sell signal as well.
Cheers,
Ivan.
Search in ideas for "RATIO CHART"

Pair Trade: Long Silver and Short Gold. Based on predictions of Fundamental Analysts, and in particularly Chris Weston's opinion.
Technically Ratio charts has broken Ichimoku cloud on Daily.
Initiating the following trade:
Long Silver Short Gold.
To make market neutral dollar value, proper dollar risk must be calculated for both contracts.
For example, for standard lots in Axitrader standard MT4 account we shall open the following trades:
Long XAGUSD 0.12 Lots
Short XAUUSD 0.08 Lots
It is almost neutral, the bias is only $250 towards Long XAGUSD.

LTCCNY - Litecoin Could Be About To See The Day Light - UpdatedUnfortunately, the support we identified in previously published chart gave way for another bearish move. Reviewing the wave counts are not made easy in instruments likes this particularly with lack of historical data.
However, it seems at least in this bearish cycle a pull back could be anticipated for the following reasons:
1. RSI at potential support.
2. ADX suggesting that the move is very stretched and corresponding pull back in price might be already in progress.
The Fib Extensions could often help but most of these are failing due to lack of proper pivot points and the fact that it has declined so much. Nevertheless I have adjusted the counts for wave (iv) & (v) suggesting that wave (v) is well advanced and could complete soon but caution should be exercised.
Conclusion is that once we get a pull back we still have 1 more drive to compete wave iv of (v) that could form a bottom near 8 or probably 5.
RSI noted above is also showing larger divergence in formation which if it holds could support the idea that final low could develop around 8 -5 zone.
LTC/BTC ratio chart has also broken down and is shown below with counts adjusted accordingly.
Similarly, the BTC daily chart we have been following as our roadmap also has some way to go yet, hence further weakness is expected and may be both will bottom together.
So unfortunately the light of day will shine through but appears to be postponed for now.
As always, do you own analysis and be quick to adjust you views according to progression of price data with time.

$SPX vs. $DAX ratio chartshould help to detect support and resistance zones
and also strenght of a trend when this one is clearly recognized
in the last month DAX was catching up so if it loses strenght again this would be bearish for markets for middle term

Dollar vs. inflationDollar is getting stronger recently, but a stronger dollar does not mean much if it is weaker than inflation. This DXY/TIP ratio chart tries to show that technically dollar is rising but is still weak comparing with inflation protection bond. Before I hold dollar for long term investing, I would like to see at least:
. the ratio breaks the blue resistance line to the up side.
. Stoch turns up above 30.
. MACD turns up and above 0.
. RSI breaks the blue resistance line to the upside and the value is above 50.

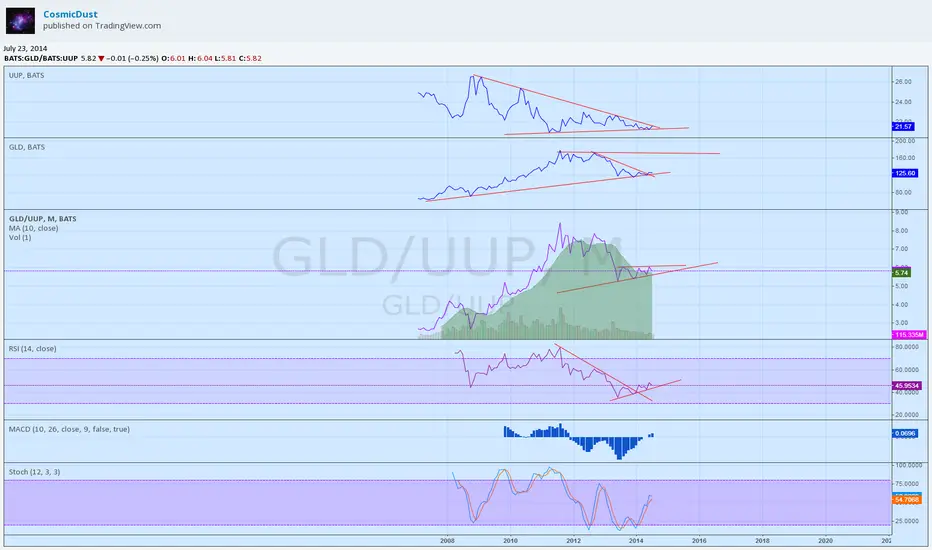
Interesting time for gold and dollarGLD still appears to have the edge over dollar on the monthly ratio chart. But it is not rare that gold and dollar rise at the same time.
RATIO TRADE - LONG TESLA TSLA VERSUS SHORT PRICELINE PCLNSINCE BOTH TESLA TSLA AND PRICELINE PCLN reported earnings and those are now out of the way, I'm willing to say that I think PCLN will underperform TSLA and continue the pattern here of a giant cup&handle formation. I was tempted to post this trade prior to the earnings, but didn't think it was worth the risk of a massive gap-move on earnings day.
I think the return will come from PCLN going down and TSLA going sideways, but this RATIO CHART is the daily price ratio of the stock prices. Think of it like a $16 stock with the ratio at 0.16 here. If it goes up to 0.19 it will be a relative 13% gain in TSLA versus PCLN. The risk is roughly 10% but the odds are high for a profit, from my perspective.
This is truly not a CUP&HANDLE in the truest sense of the definition - it isn't a show of "accumulation" of Tesla relative to Priceline, rather it is just a chart pattern that is similar to it. It doesn't have the LOGIC of the accumulation pattern that an actual stock will have.
Cheers.
Tim 10:45AM EST 5/9/2014

The case for emerging market1. Emerging market shows strength, as shown on the VWo/VTI ratio chart.
2. As of last trading day of April, it broke a major resistance line that has been there since April 2011.
3. 3 month moving average crossed above 5 month moving average, a buy signal.

The aLTCoin Market's Moment Of Truth Is Upon Us! (Version 2.0)This is a follow up to a chart I posted yesterday here:
I wanted to prepare a chart to illustrate the current predicament Litecoin & to a greater extent, the entire altcoin market now finds itself in. This time I wanted to focus in much greater detail what possible scenarios might play out.
Litecoin is fast approaching a historic 'Moment of Truth'. Right now, LTC is either the most undervalued coin on the crypto market. Or what the Bitcoin purist have been saying about Litecoin & the entire altcoin market, was right all along.
You will notice on both the fiat & ratio chart Litecoin has now almost run out of bear territory. It will either break support, or the bulls will chase it onto higher ground.
Breaking the ratio support line at this point in time in the current market cycle is nothing new, and it may even be argued that it's historically overdue. But to do so at this moment would also result in a break of support in Litecoin's fiat value! This has only ever happened once, since Litecoin's inception, for but a brief moment during a flash crash way back on the 25th October 2012. This time though the bears have worked Litecoin's fiat value down into this predicament (or opportunity).
With all the FUD out of China at the moment & Litecoin's explosive reputation in upside volatility I wouldn't be surprised whichever way this plays out. The only thing that would surprise me is if LTC's value hits those support lines & doesn't do something explosive upside or down.

GOLD $GLD $XAUUSD vs Emerging Currency Fund $CEWnegative correlation like for 6 months?
lower ratio chart should help Gold "PuLLss $ PeRRss" :)
grooveshark.com

Sequel to "Same ratios on this movement" chartIt's still early, but the ratio chart I made () seems to be playing out, so I wanted to extend on it and do some more analysis.
In this chart I cover some more of the similarities between these rallies and what to look for going forward which could give confirmation to this prediction.


SPX vs. shot term volatilityGood chances that it will get ugly for S&P if it loses 1.618 extension on this ratio chart- next support middle bollinger lines & extension 1.

GBPUSD vs. Dollar index ratio chart weeklyLooks like GBPUSD wants higher - but could take some time to form symmetrical inverse H&S.


AA weeklyCareful with this one. Aluminum still in the bottoming process. Some support lines on ratio chart vs. DIA. Long above weekly EMA8, especially if it goes lower and then regains it.

GDXJSome support on the ratio chart vs. SPY (false breakdown could be a good sign). Long above VStop on the daily chart.

MCD vs. SPY ratio chartStrong support here (monthly EMA 100). MCD could start to run higher here - some obstacles ahead = aligns with volatile markets ahead.


Currency is leading German index higher this yearCorrelation is at the top, momentum is waning. Ratio chart has some decent support at the horizontal line.
